

Pivot Points Trading Strategies
Technical Analysis Indicators Strategies • 13 min
CCI (Commodity Channel Index) was developed in 1980 by Donald Lambert. This indicator is an oscillator which helps to identify overbought or oversold markets periods, like the majority of indicators in this category. This is a linear oscillator that looks like RSI, but has its own features and advantages. What is special about the CCI indicator and what is the most effective way to use it in trading?
The CCI indicator shows when the current price level is far above/below the moving average. The moving average period is set by the trader. The stronger the price deviation in the short term relative to its averaged value, the higher (in case of an uptrend) or lower (a downtrend) the oscillator line will go from the zero point. Most of the time the indicator line oscillates between levels +100 and -100. When the line leaves this range, you get a signal about asset being overbought or oversold. This is a basic signal of the Commodity Channel Index.
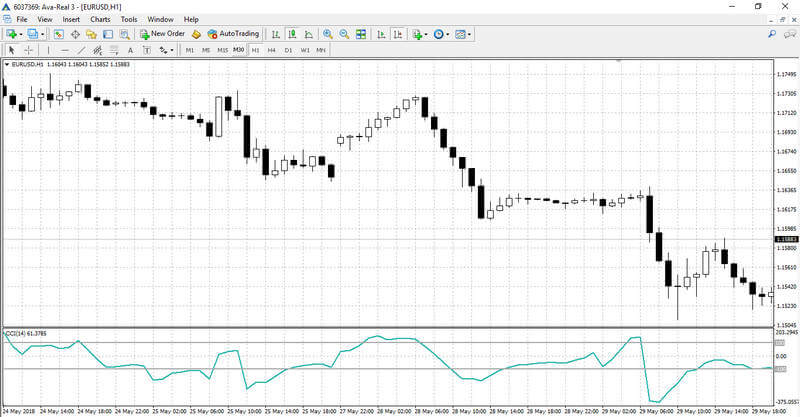
CCI, unlike RSI or Stochastic Oscillator, is not limited by levels +100 and -100. The Commodity Channel Index line may fall to levels -200 and -300, which will only indicate that the downtrend is very strong and the market is in a state of deep oversold.
The CCI indicator is plotted according to the following formula:
CCI = (0.015*Standard Deviation) / (Typical Price – SMA)
Commodity Channel Index is plotted in the same way as other indicators. There are two ways to plot the indicator:
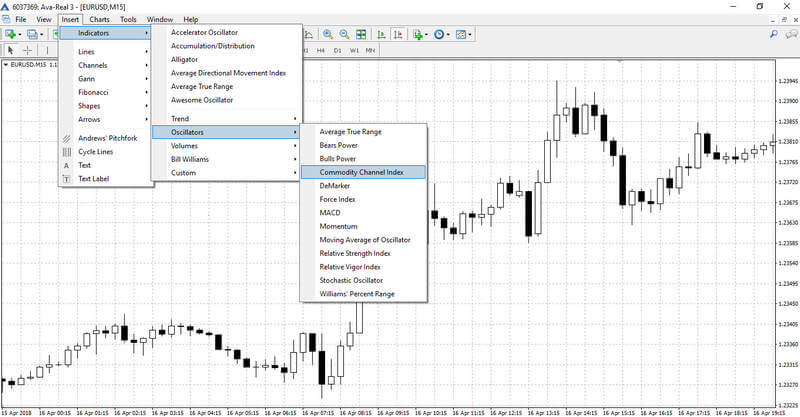
The second version is a little faster and more convenient in practice. Indicator’s settings window will open after selecting it on the chart. The only parameter that can be changed is the period, but it affects all values in the indicator’s formula. Indicator’s sharpness depends on the period value as it is in other oscillators. The CCI line will move quickly from level to level when the period is small and it will move smoothly, oscillating mostly around the zero point, when the period is large.
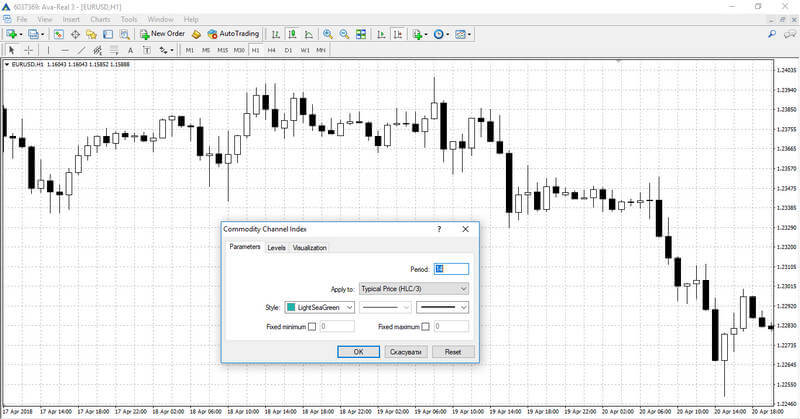
Also horizontal levels can be added or removed in “Levels” tab in the settings window.
The most effective way to use the Commodity Channel Index, like the majority of oscillators, is to use it as a filter. However, this indicator can also provide highly reliable signals to enter the market.
Overbought and oversold are the basic oscillator signals relevant for the CCI as well. Orders are opened with these signals as follows:
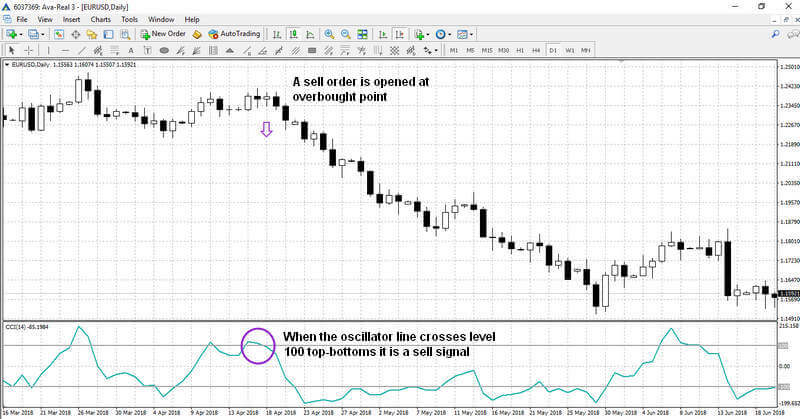
It is worth noting that such signals appear quite often and many of them turn out to be false in the end. It is better to add an additional indicator to the system or to increase the normal oscillation range in order to filter false signals. The overbought/oversold levels can be moved to +150/-150 or +200/-200 for this matter.
Divergence is considered to be one of the strongest oscillator signals. Explicit divergences and convergences are formed much less often than just entering overbought and oversold zones, and therefore they produce a more reliable signal. Convergence and divergence can be identified by drawing lines through two or more local extrema on the graph and the respective local indicator extrema. When the trend line on the price chart and the trend line on the indicator are moving in the opposite directions, there is high probability of trend changing.
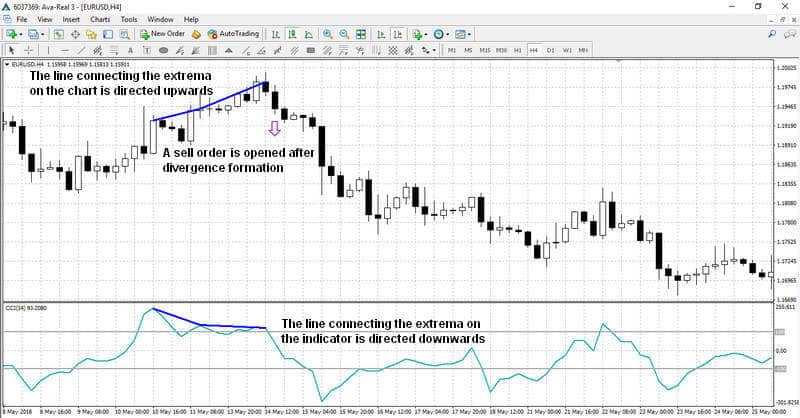
Convergence and divergence orders are opened the following way:
You can also exit orders with the Commodity Channel Index signals, when the line crosses the indicator in the opposite range. Each order must be protected with a stop loss (set on a local extremum or at a key price level).
Many traders wonder how CCI compares to other widely used momentum indicators like the Relative Strength Index (RSI), Moving Average Convergence Divergence (MACD), and the Stochastic Oscillator.
While all these tools help traders identify overbought and oversold conditions, they have distinct applications.
| Indicator | Main Purpose | Best For | Key Weakness |
| CCI | Measures price deviations from the statistical mean | Identifying extreme price movements and breakouts | Can give false signals in choppy markets |
| RSI | Tracks overbought/oversold levels (0-100) | Trend reversals and divergence confirmation | Prone to lagging in strong trends |
| MACD | Identifies trend direction and momentum | Confirming bullish/bearish crossovers | Less effective in ranging markets |
| Stochastic | Compares closing price to range over time | Identifying reversals in sideways markets | Gives premature signals in strong trends |
By understanding these differences, traders can use CCI in combination with other indicators for higher-probability trade setups.
Test CCI against RSI, MACD, and Stochastic indicators using a free AvaTrade demo account.
Open a Demo Account
While the Commodity Channel Index (CCI) is a versatile momentum indicator, it performs best under specific market conditions.
Traders who understand these conditions can significantly improve their trade accuracy and reduce false signals.
One of the biggest pitfalls traders encounter with CCI is applying it in the wrong market environment. Here’s a breakdown of when CCI is most effective:
| Market Condition | How CCI Performs | Best Strategy |
| Strong Uptrend | CCI often remains above +100 for extended periods | Use pullback entries when CCI retraces near zero |
| Strong Downtrend | CCI stays below -100, signalling ongoing momentum | Short on minor pullbacks when CCI retraces near zero |
| Sideways Market | CCI fluctuates between +100 and -100 frequently | Best for mean-reversion strategies (buy at -100, sell at +100) |
| Choppy Market | Frequent false signals | CCI is unreliable under these conditions. Better to use other indicators and signals. |
Key Takeaway:
The effectiveness of CCI also depends on the trading timeframe. Here’s how it works across different timeframes:
| Timeframe | Best Use for CCI | Common Pitfalls |
| 1-Min / 5-Min (Scalping) | Spotting quick overbought/oversold signals for short-term trades | Prone to noise and frequent false signals |
| 1-Hour / 4-Hour (Swing Trading) | Identifying trend pullbacks and divergence setups | Works best with confirmation from other indicators |
| Daily / Weekly (Position Trading) | Recognizing major trend reversals and strong momentum shifts | Signals appear late, requiring patience |
Pro Tip: Traders can enhance their trade accuracy by using multi-timeframe analysis, such as confirming a 4-hour CCI signal with the daily trend.
One of the biggest concerns traders have with CCI is its tendency to generate false signals, especially in unpredictable market conditions. Here are some filtering techniques to improve accuracy:
Confirm with Price Action:
Use CCI Divergence:
Apply Moving Averages for Trend Confirmation:
Let us add one more indicator – a simple moving average with period 100– to the CCI system in order to improve signals quality and, accordingly, trading efficiency. It is better to use the CCI + MA strategy for short-term trading, opening orders when prices retrace from MA. The moving average will be used as a support/resistance line in this case. M15 is the optimal time frame for trading, but let us also add scalping at M5.
Orders are opened the following way:
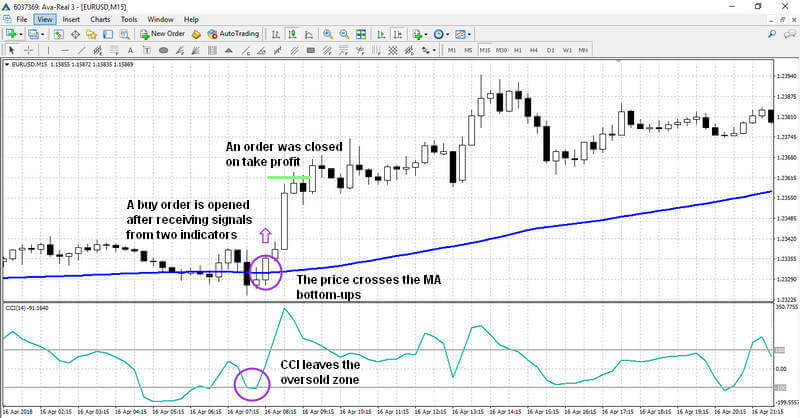
The easiest way to exit an order is with fixed stop losses and take profits. The main thing is to maintain the 3:1 P/L ratio (for example, planning to make 30 points profit with 10 points of affordable losses in one order).
In conclusion, let us take a look at a more complex CCI strategy which, nevertheless, is suitable both for beginners and professional Forex traders. Beginners will be able to quickly understand the trading strategy through clear entry-exit rules, and experienced traders will be able to improve the system and achieve even greater efficiency with it. All indicators in the system (CCI, MACD and Parabolic SAR) are set with the default settings. H4 is the optimal time frame for trading.
Sell orders are opened with this strategy under the following conditions:
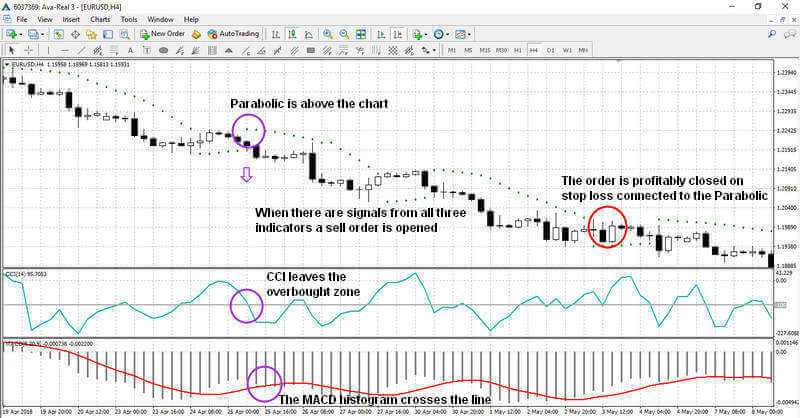
Buy orders are opened on the opposite conditions. This system offers some flexibility with closing the positions. Given the 4-hour timeframe, a trader can manually move the stop loss, setting the exit price using the Parabolic marker. Thus, you can capitalise on the entire trend without limiting your profit to a pre-set level. This trading strategy best results for Forex trading, but it is not recommended for shares or cryptocurrency trading since different instruments tend to have different price action dynamics.
Beyond basic overbought/oversold readings, experienced traders can utilise advanced CCI techniques to refine their entries and exits. Here are three powerful methods to enhance CCI-based trading strategies.
Using CCI across multiple timeframes helps filter out weak signals and confirm high-probability trades. The key principle is to align the CCI signal on a smaller timeframe with the broader trend on a higher timeframe.
How It Works:
Example Setup:
Why It Works:
Volume is often the missing link when using CCI alone. By integrating CCI signals with volume confirmation, traders can validate momentum shifts.
How to Use It:
Example Trade:
A CCI divergence occurs when the price makes a new high or low, but CCI fails to confirm the move, signalling a potential reversal.
How to Spot Divergence:
Best Practices for Divergence Trading:
Apply advanced CCI strategies with real-time market conditions using AvaTrade’s demo account.
Open a Demo Account
While the Commodity Channel Index (CCI) is a valuable indicator, traders often make avoidable mistakes that lead to poor performance. Below are the most frequent errors and how to correct them.
The Mistake: Many traders enter trades solely based on CCI crossing +100 or -100 without verifying price action.
This often results in premature entries, as CCI can remain at extreme levels for extended periods.
The Solution:
Example:
If CCI crosses above +100, but the price fails to break a key resistance level, the signal is weak and should be ignored.
The Mistake: Traders often apply CCI in all market conditions without considering whether it is suited for the current environment.
The Solution:
The Mistake: Some traders do not set stop-losses when trading with CCI, assuming that an extreme reading will always lead to a reversal.
This can be dangerous, especially when the trend continues against the trade.
The Solution:
The Mistake: Many traders assume that CCI divergence always leads to a reversal, but in strong trends, divergence can persist for long periods before the price reacts.
The Solution:
The Mistake: The default 14-period CCI may not be optimal for all trading styles. Some traders use it blindly without adjusting for volatility or timeframe.
The Solution:
Learn to manage risk effectively by testing CCI strategies in a risk-free demo environment.
The Commodity Channel Index, or CCI, is a technical indicator that was developed to identify market trends. Although it was originally developed for use in the commodities markets, it can be used just as well with equities and with currencies. The indicator will typically move within a range of +100 to -100, but unlike other oscillators it is not confined to that range. In fact, moves above +100 or under -100 are used as trading signals in some cases since they signal that the market is strongly bullish or bearish, and when they reach extreme levels that the market is overbought or oversold.
Professional traders use the CCI to let them know when a trend has strengthened or weakened significantly. For example, a long trade wouldn’t be triggered by the CCI until it rises above +100. Once the indicator is above that level is when a bullish trend is really getting started, and when serious profits are able to be extracted from the markets. While some traders will place an order as soon as the CCI crosses above the 100+ level, others wait for confirmation in the form of a pullback that stays above the zero line, followed by another move above 100+. It is this second move that is bought and that brings the best chance of profits.
The basic trading strategy when using the CCI is to buy when it moves above 100+ and to sell when it moves below 100-. However there are some additional criteria that can be added to make the CCI trading strategy more robust and profitable in the long run. The first is to wait for a pullback that doesn’t break the zero level and then trade on the second break of the 100+ or 100- line. This increases the probability of the signal being valid. Another way to improve the trading strategy is to use multiple time frames. In this case the trend is first established on a weekly or monthly chart and then traders use short time frames to trade, but only trade in the direction of the long term trend.
The Commodity Channel Index is a reliable and effective indicator, but it has its disadvantages as well. More specifically, it is good for identifying market entry points (especially in conjunction with other indicators), but it is better to use traditional signals for closing the positions. The thing is that when a strong trend is present, CCI moves quite quickly from the overbought to the oversold zone and vice versa, and if this is perceived as a reversal signal, most of the profit from the original position can be lost. All in all, CCI is a good “team player” which shows good results in conjunction with other indicators. However, it is not a good idea to open orders using only The Commodity Channel Index signals, because CCI, like the majority of oscillators, is first of all a filter created for elimination of other indicators’ false signals.
Open your trading account at AvaTrade
or try our risk-free demo account!
Trading in financial markets puts your capital at risk. It is recommended to accurately follow the money management rules and always set Stop Losses in order to reduce risks. This article doesn’t constitute an investment/trading advice. We recommend you to visit our trading for beginners section for more articles on how to trade Forex and CFDs.
The Commodity Channel Index (CCI) is a powerful tool for traders seeking to identify momentum shifts, overbought/oversold conditions, and potential trend reversals. However, its effectiveness depends on proper application and risk management.
By incorporating multi-timeframe analysis, volume confirmation and divergence strategies, traders can significantly improve their trade accuracy.
Moreover, avoiding common mistakes such as over-reliance on CCI signals, ignoring market conditions, and failing to use stop-loss orders can prevent unnecessary losses.
Key Takeaways:
Start applying CCI trading strategies with real-time market data in a risk-free environment.
Open a Demo Account
Technical Analysis Indicators Strategies • 13 min

Technical Analysis Indicators Strategies • 12 min

Technical Analysis Indicators Strategies • 15 min

Technical Analysis Indicators Strategies • 10 min

Technical Analysis Indicators Strategies • 11 min

Technical Analysis Indicators Strategies • 15 min

Technical Analysis Indicators Strategies • 13 min

Technical Analysis Indicators Strategies • 8 min

Technical Analysis Indicators Strategies • 15 min

Technical Analysis Indicators Strategies • 12 min

Technical Analysis Indicators Strategies • 12 min

Technical Analysis Indicators Strategies • 13 min

Technical Analysis Indicators Strategies • 13 min

Technical Analysis Indicators Strategies • 20 min

Technical Analysis Indicators Strategies • 10 min

Technical Analysis Indicators Strategies • 13 min

Technical Analysis Indicators Strategies • 18 min

Technical Analysis Indicators Strategies • 8 min

Technical Analysis Indicators Strategies • 12 min

Technical Analysis Indicators Strategies • 6 min